Research | Gemini Prospect | Overview
EM Lab Personnel:
Kerry Key, Steven
Constable
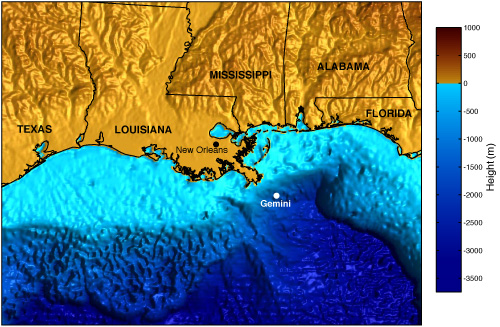
Gemini Prospect is located
in the deepwater Gulf of Mexico about 100 km southeast
of New Orleans. The bumpy seafloor bathymetry in the
northern Gulf of Mexico is due to deformation from underlying
salt sheets and intrusions that are often a few kilometers
or more thick. The salt was deposited in the late Jurassic
as
shallow seas associated with the break-up of the Gulf
of Mexico dried up. Later deposition of organic material
from the Mississippi river covered the salt with several
kilometers of sediments. The overburden caused increasing
pressure and temperature on the organic material, transforming
it into hydrocarbons. Salt has a relatively low viscosity
and density compared with the brittle overlying sediments
and flows upward and laterally, deforming the sedimentary
layers in processes collectively known as salt tectonics.
Sometimes the deformations form structures which trap
hydrocarbons.
Petroleum exploration
companies
target
these structures.
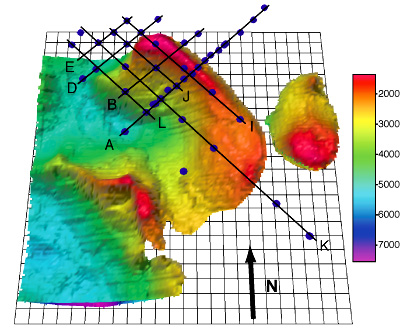
An industry 3D seismic reflection survey
at Gemini Prospect revealed the complex 3D shape of
the Gemini salt structure, shown above as the colored
surface. Depths are in meters. While the seismic method
is good at detecting structural boundaries such as
sedimentary layers and the
top
of
salt surface,
steeply dipping salt and the deeper bottom of salt
is often harder to detect. In order to provide better
constraints on the base of salt depths, we developed
the broadband
marine magnetotelluric (MT) method for investigating
the electrical conductivity structure of salt structures.
In 1997, 1998, 2001 and 2003 we collect 42 sites of broadband
marine magnetotelluric
data in
the
period
band of 1-3000 s at Gemini, shown as blue circles.
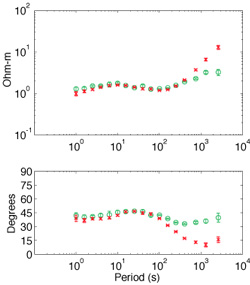
An example of the MT apparent resistivity
and phase data from Gemini Prospect is shown above. Red
symbols are for the impedance component with the electric
field oriented to the south-east and green symbols are
for the electric field oriented to the north-east. MT
is typically used to detect conductive structures, however,
in our case we are using it to detect the resistive salt
(around 100 ohm-m) that is surrounded by conductive sediments
(about 0.5 ohm-m). When a resistive structure is about
10 times or more resistive than the surrounding rocks,
electrical
currents flow around it and the MT response saturates.
This is seen in the small signature of the resistive salt
in the MT response at periods around 10
s.
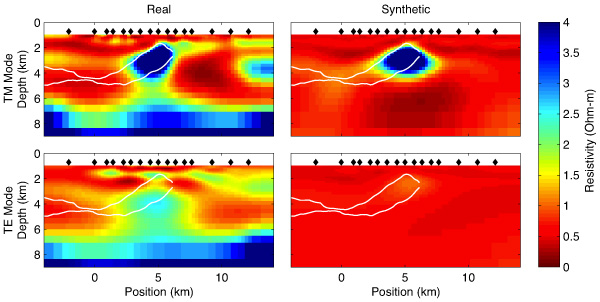
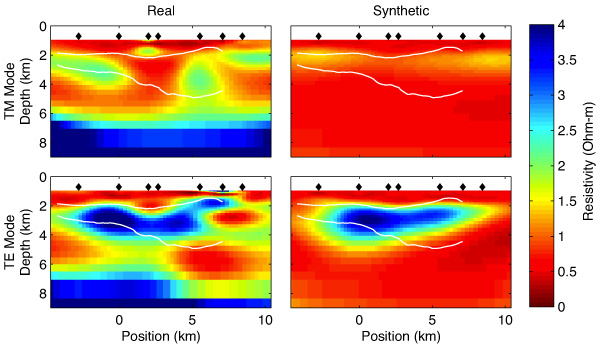
The MT data from the lines shown in
the map figure where inverted using the OCCAM2DMT inversion
routine. Above we show inversion models obtained from Line
A's data (left). In order to study the potential 3D effects
in present in our 2D modeling, we performed a synthetic
inversion of the 3D MT response of the
seismic
salt structure
(right).
The top row shows the results for the TM mode (electric
field oriented along the direction of line A, an azimuth
of about 45
degrees) and the bottom row shows the TE mode (electric
field oriented perpendicular to the line of sites) inversion.
Black diamonds show the location of the MT sites and
the white lines show the seismic salt profile. Both the
real data and synthetic inversion show better agreement
with the seismics for the TM mode data. The resistive
blue feature correlates well with the seismic salt where
it is less than about 4-5 km deep. Deep and thin
salt does not contribute enough to the MT response to
be detectable. Note that line A is the most amenable
to 2D modeling as it cuts across the middle of the salt
ridge.
The inversion of Line I's data showed
an unexpected result--the TE mode (electric field perpendicular
to the line direction) gave better agreement with the
seismic salt structure. This suggests that 2D inversion
for resistive structures works best when inverting the
mode with the electric field oriented across the dominant
structural strike. This inversions also shows how marine
MT can constrain the base of salt depths here and discriminate
between deeply rooted and shallow salt.
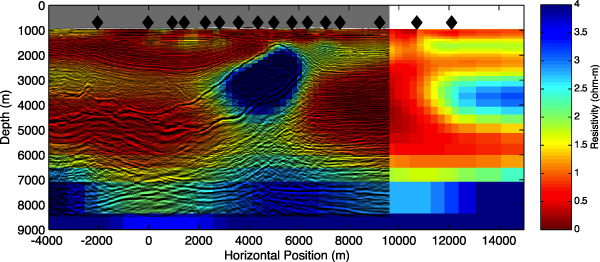
In order to better understand the structure
at Gemini we have plotted both the marine MT electrical
conductivity (resistivity) model and the seismic reflection
data on top of each other. The bright reflections in
the seismic profile correlate well with the blue resistive
salt structure. Salt at depths of about 4.5 -5 km is
too thin to contribute to the electrical data and so
is not recovered in the electrical conductivity model.
Not the correlation of shallow resistive features with
some of the rougher seismic reflections. During the 2003
survey we deep-towed our active-source EM transmitter
(SUESI) along Line
A. Preliminary analysis of this data requires a thin
and shallow conductor at positions of 6 - 10 km, which
correlates
with the resistive near surface layer shown above.
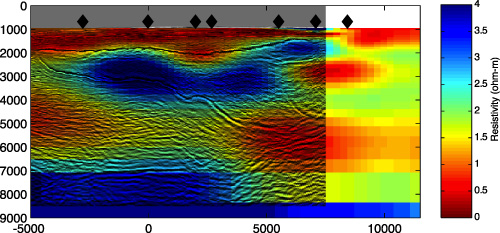
The combined MT and seismic results for
Line I. Notice the thin finger of overhanging resistive
(blue) salt that correlates well with the top of salt
reflection and another shallow reflection beneath. This
shows how broadband marine MT can image overhanging and
steeply dipping salt structures.
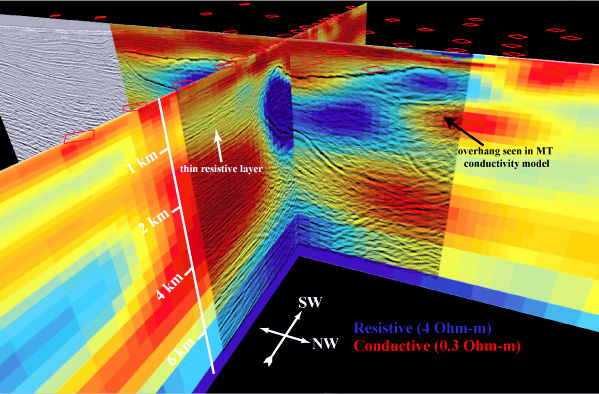
A 3D view of the combined MT and seismic
results for Line A and Line I. Click
here for a free 3D visualization of Gemini Prospect. |

