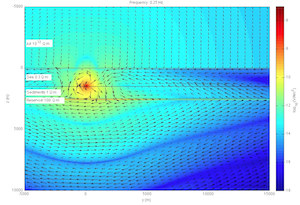
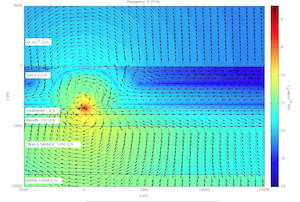
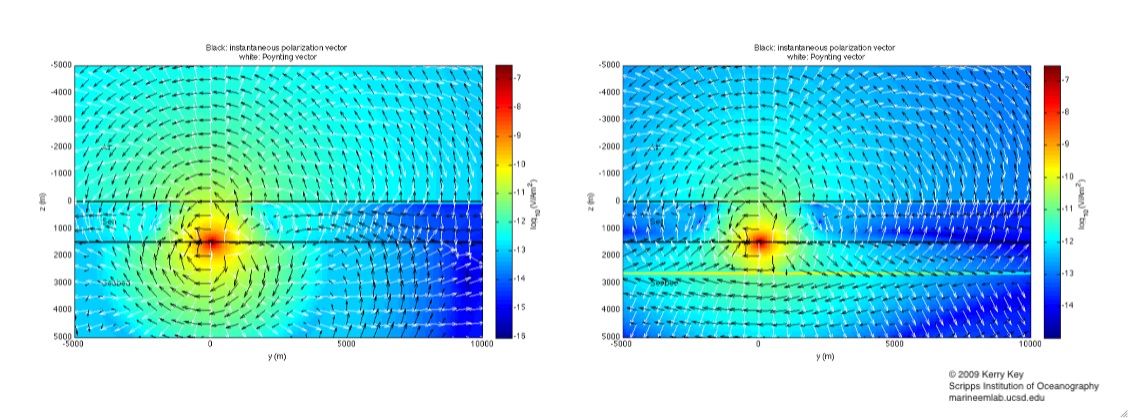
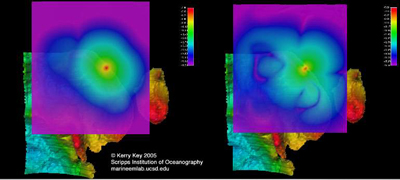
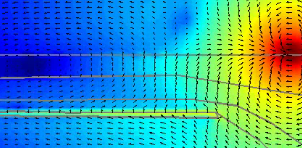
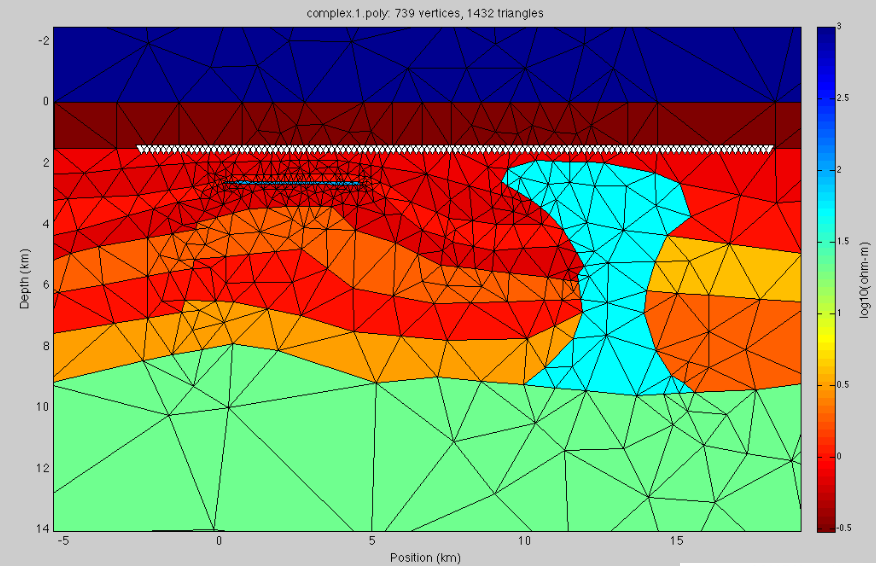
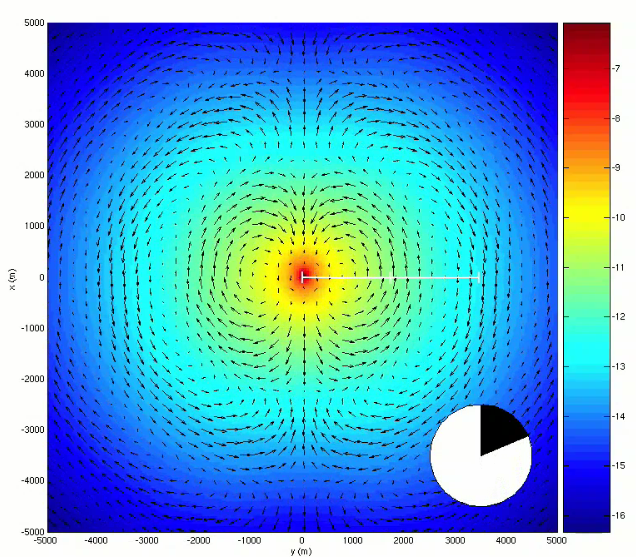
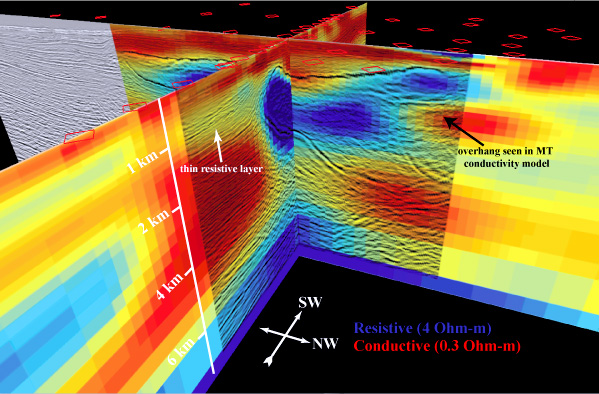
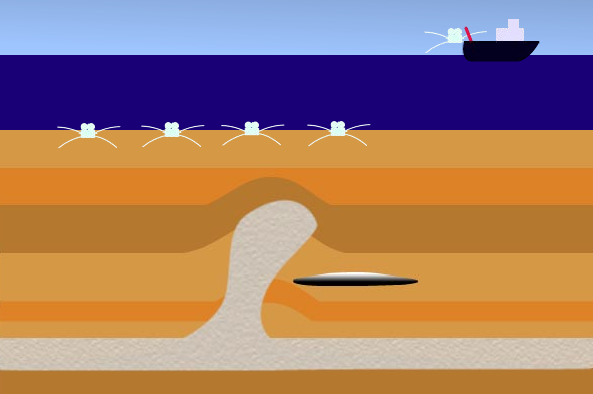
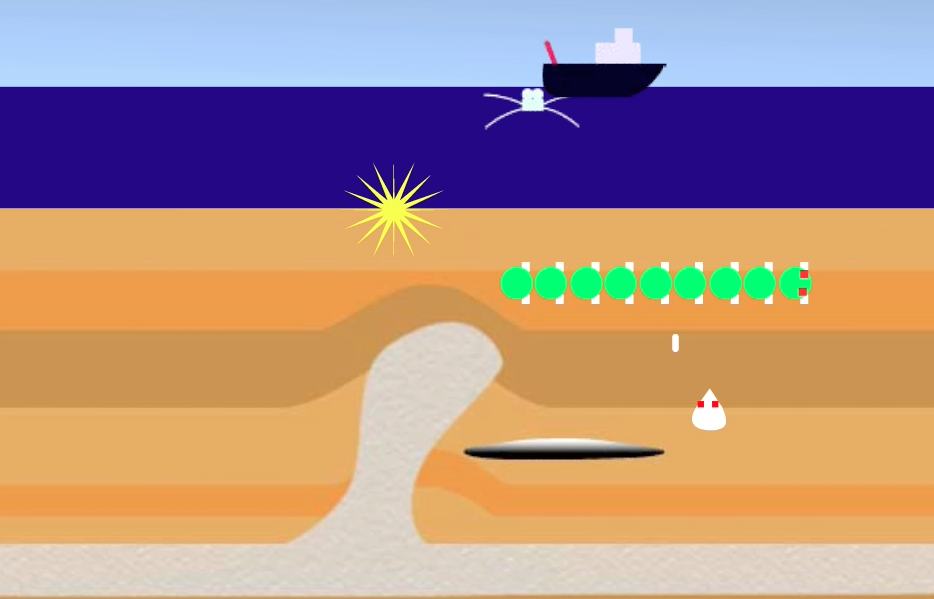
Scripps Main Website Marine EM Lab Main Website Marine EM Laboratory


Electromagnetic Geophysics Visualizations

Here are visualizations I've made of marine electromagnetic induction model studies and field experiments. These can be quite useful for teaching EM geophysics concepts (for instance, check out the Complex CSEM movie).

Click the images to view the visualization pages.

A movie showing the CSEM diffusion in a 1D model without and with a thin hydrocarbon reservoir. White arrows show the direction of energy propagation and black arrows show the instantaneous electric field polarization. Watch how energy diffuses up from the reservoir and down from the air, and look for the interference zones where the Poynting vectors point at each other. Quicktime Movie (7.4 MB).
3D marine CSEM forward modeling of Gemini salt body, Quicktime Movie
Offshore oil exploration with marine CSEM visualization: electric field vectors and amplitudes in a time lapse simulation, Quicktime Movie
Quicktime movie of the adaptive refinement of a finite element grid used for a marine CSEM model study. Essentially a summary of the MARE2DCSEM paper in a single movie.
Electric dipole in a whole-space time-lapse movie. Useful for explaining EM diffusion. Quicktime movie and Matlab code.
Gemini Prospect marine magnetotelluric survey for base of salt mapping. This is a 3D visualization of MT inversion models with depth migrated seismic reflection data overlain. This was created as part of my Ph.D. thesis. Click the image to visit the Marine EM lab web page, where you can download the Fledermaus 3D file and fly through the scene using the free iView3D viewer.

An animated cartoon explaining the marine magnetotelluric method that I made for part of an entry in the Scripps Visualization Center student contest in 2003. At some point I will replace this with animated field lines computed from a rigorous model computation, such as using MARE2DMT.

   
email: kkey@ucsd.edu
Last modified: August 21 2009 16:47.