Following earlier work by Constable and Constable (2004), we have created a new Grand Spectrum of the geomagnetic field that is verifiable and reusable. A manuscript describing the details of its creation has been published in the SEDI 2022 special issue of PEPI. Here is the abstract:
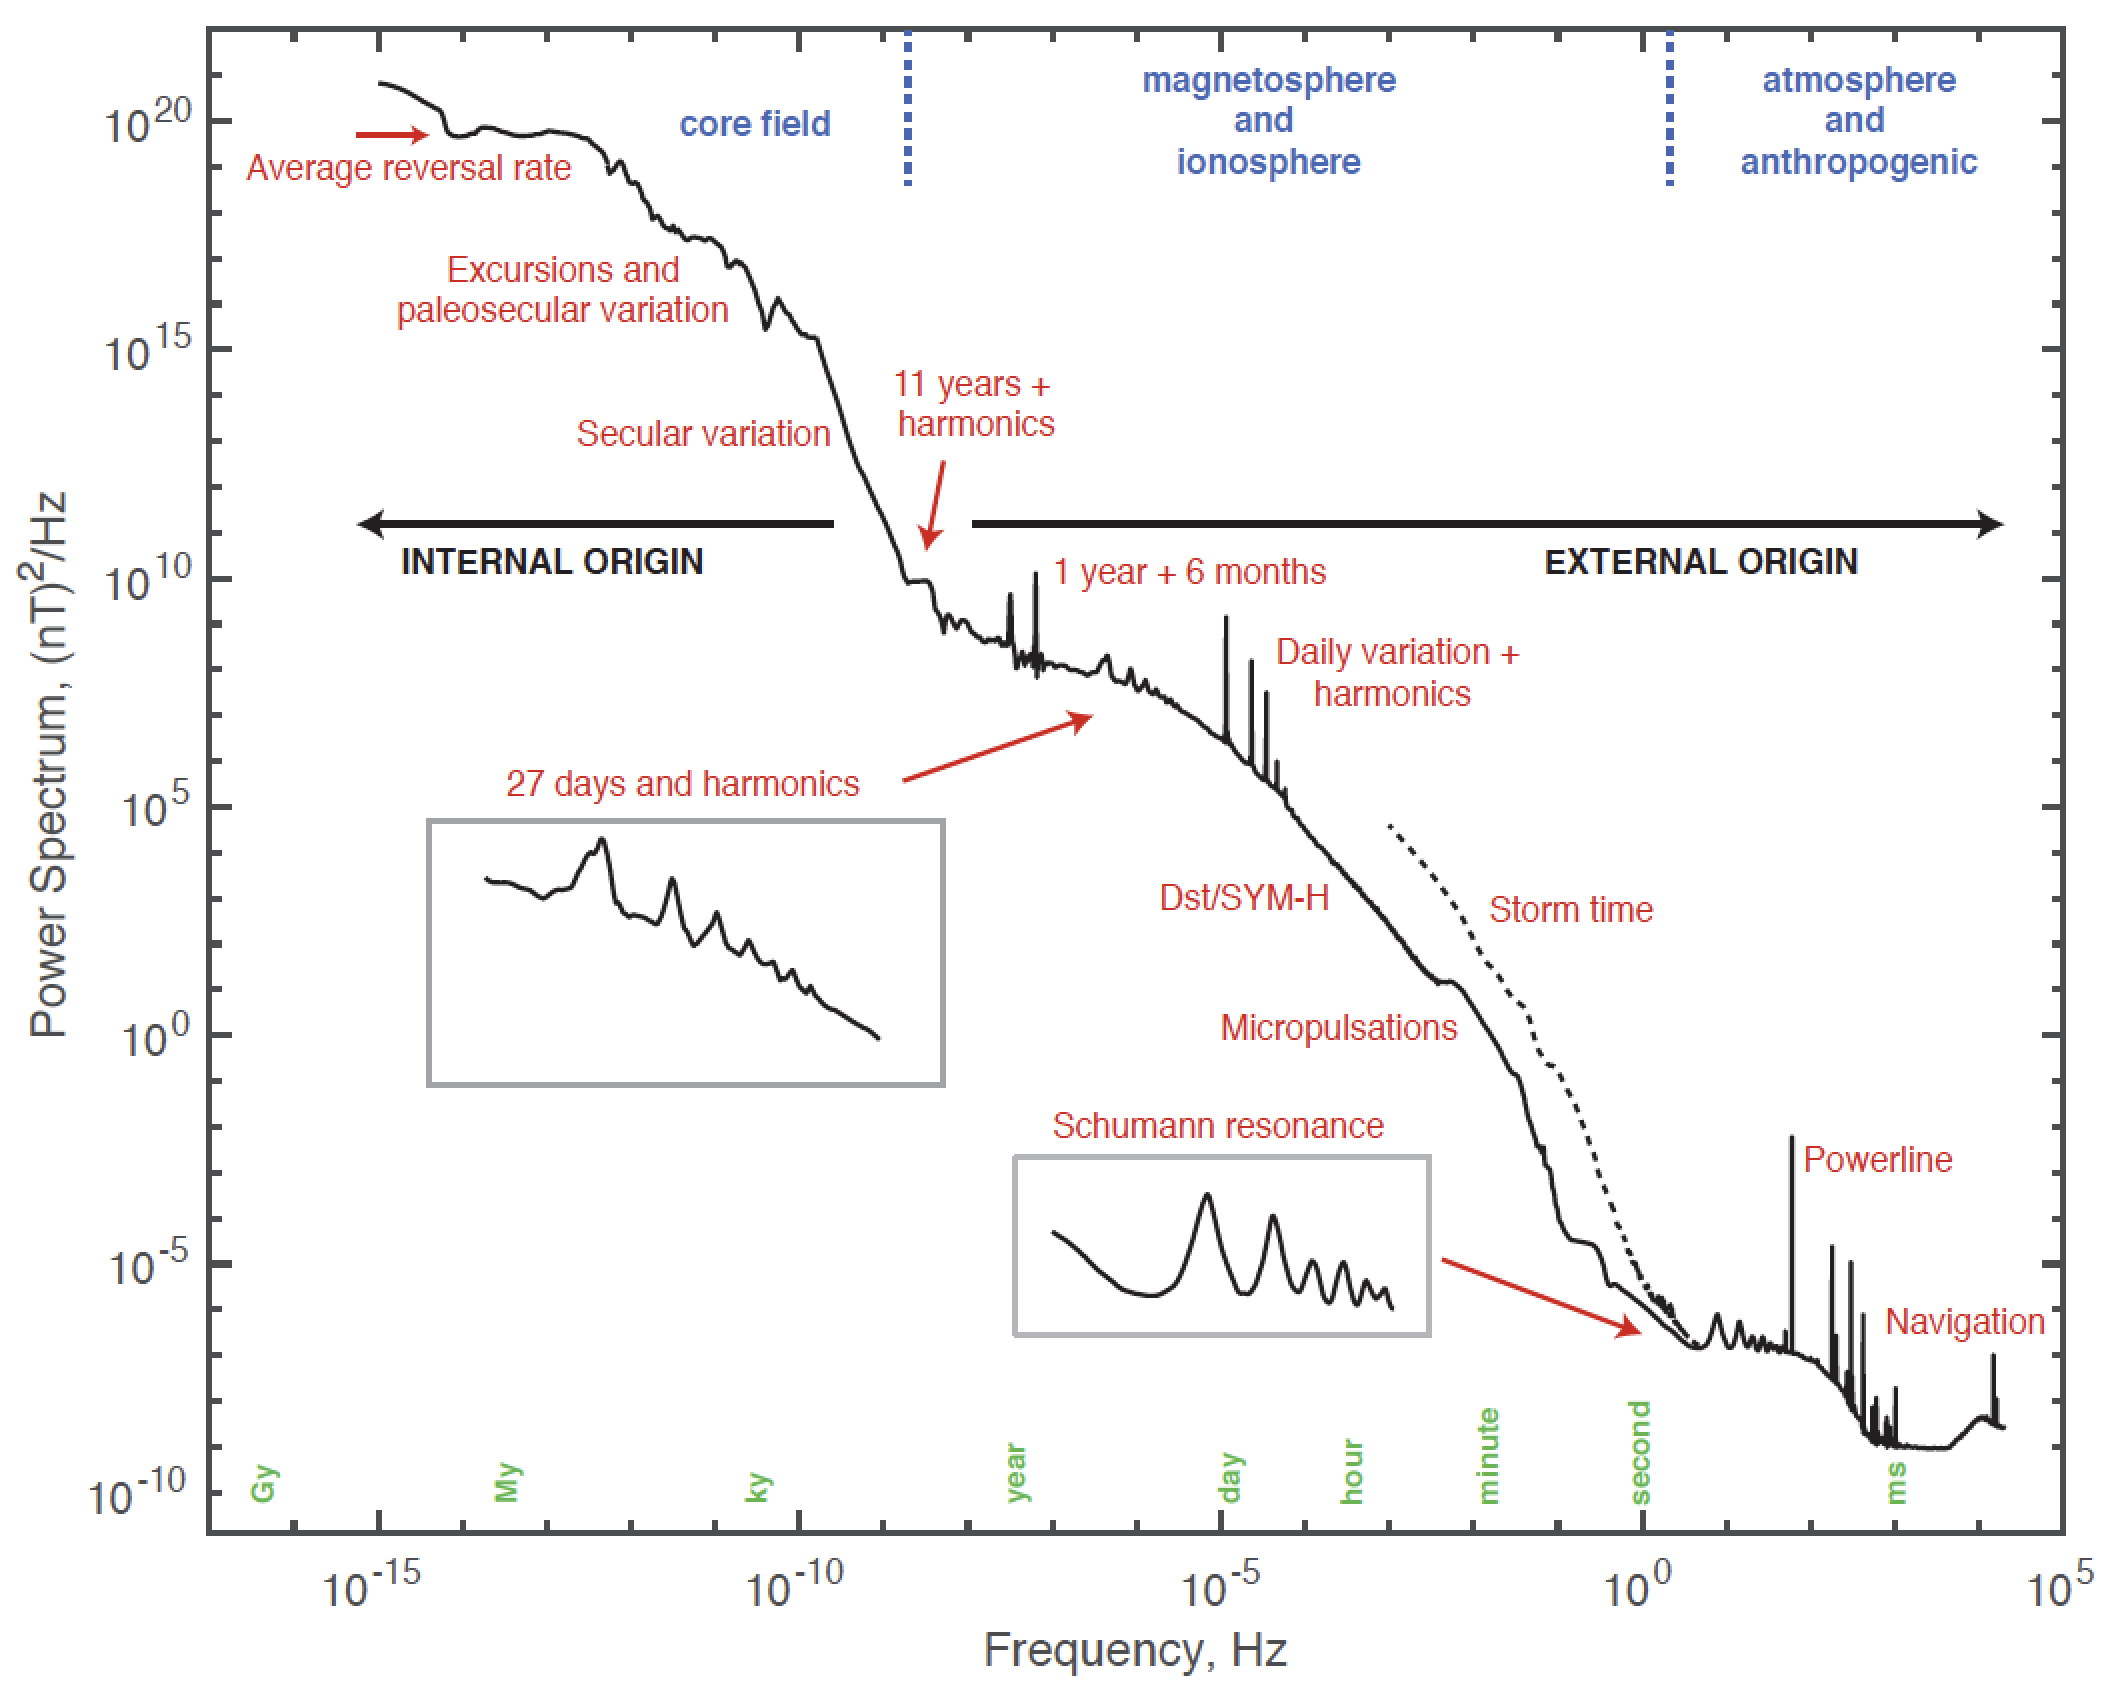
The spectrum of geomagnetic variations is broad and reflects multiple internal and external physical Earth processes. The geodynamo generates an internal magnetic field, dominated by the low frequency contribution of the axial dipole whose temporal variations range from geomagnetic reversals, excursions, and large-scale paleosecular variations, down to decadal and sub-annual changes. Variations in the external field arise from high frequency interactions of the solar wind with Earth's magnetosphere and ionosphere, along with excitation within the atmospheric cavity by lightning, power systems, and radio transmissions. External variations induce a field in the conductive Earth that adds to the internal signal. A spherical harmonic analysis of over 100 years of observatory data allows us to show that the external field is larger than the internal field at periods of the 11-year sunspot cycle and shorter. Using spectral estimates derived from this and other data sets using adaptive multi-spectral time series analysis, we can create a composite power spectrum that spans frequencies from 10-15 Hz to 20 kHz (periods ranging from 10 million years to 5x10⁻⁵ seconds), and powers ranging from 10-9 (nT)2/Hz to 1021 (nT)2/Hz. The different processes contributing to the spectrum are characterized by various inverse power laws across frequency bands. This Grand Spectrum quantifies the successive dominance of the many different geophysical processes with frequency, but importantly provides a compelling graphic to illustrate the complexity of the geomagnetic field.
Download the pdf image: grandspectrum.pdf (276 kB)
Download the zipped data: GSpectrum.zip (37 MB) (recommended)
Download the ascii data: GSpectrum.dat (291 MB) (not recommended - might open the 291 MB file in a new window)
There are 5 columns in the digital file:
Coming soon: The time series and power spectrum code.