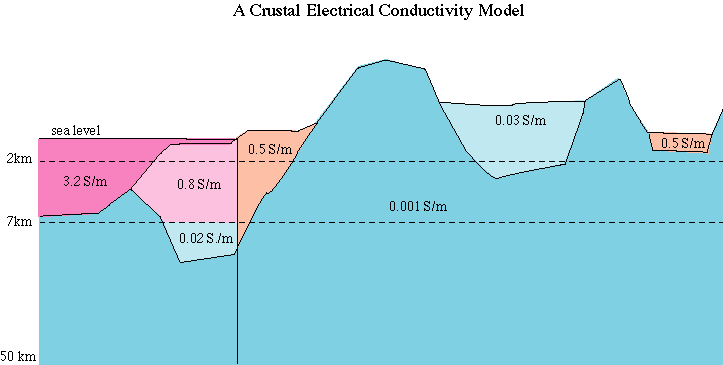
Crustal Conductance Map.
An important part of our work is to assess the effects of the continents and oceans on global induction, and in particular the interaction of the continent/ocean function with mantle conductivity structure. Many authors have modelled surface conductivity based on ocean thickness, but this ignores the effect of many sedimentary basins whose sediment thickness can exceed that of the ocean layer.
We started with the 1° x 1° global sediment thickness map compiled by Laske and Masters (1997). This map contains sediment density discretized in up to three layers; a surface layer up to 2 km thick, an underlying layer up to 5 km thick, and, where necessary, a third layer to make up total sediment thickness, which often exceeds 10 km. We created heuristic rules for generating conductivity from this map:
The world was divided into three regions based on topography;
(i) the ocean basins and continental shelves defined by elevations below sea level,
(ii) the coastal plains and low-lying continental sedimentary basins defined by elevations above sea level but below 100 m, and
(iii) the continental interiors and highlands above 100 m elevation.
In region (i), the oceans, the ocean layer was assigned a conductivity of 3.2 S/m (0.3 $\Omega$ m), the upper two sediment layers (up to 7 km thick) were assigned a conductivity of 0.8 S/m (1.25 $\Omega$ m), and the deepest sediments assigned a conductivity of 0.02 S/m (50 $\Omega$ m).
In region (ii), the coastal plains and low basins, the entire sedimentary section was assigned a conductivity of 0.5 S/m (2 $\Omega$ m).
In region (iii), the continental highlands, the entire sedimentary section was assigned a conductivity of 0.03 S/m (33 $\Omega$ m).
The balance of the section to a depth of 50 km, representing oceanic and continental igneous rocks, was assigned a conductivity of 0.001 S/m (1000 $\Omega$ m).
The primary reference for this work is:
48. Everett, M.E., S. Constable, and C.G. Constable, 2003: Effects of near-surface conductance on global satellite induction responses, Geophys. J. Int., 153, 277–286.

Download the 180 x 360 surface conductance data as a text file. (Warning- this an ascii file with very long line lengths, but it can be simply loaded into MATLAB.)
See a PDF picture of the sediment map