 |
|

|
|
lcplot: tools for Marine EM time series
Kerry Key and David Myer
A suite of Matlab codes for easy plotting of electromagnetic time series,
power spectra and spectrograms for Scripps (.bin) and EMGS (.rx2) format data
files. These codes are useful for a first inspection of marine magnetotelluric
and controlled source EM data files.
Download the Matlab codes here: lcplot Matlab
codes (59KB zip file, Nov 9, 2007)
The package comes with these routines:
| lcplot.m |
Scripps and EMGS time series plotting tool. |
| getsio.m |
Data reading kernel for Scripps format data files (.bin). |
| getrx2.m |
Data reading kernel for EMGS format data files (.rx2). |
| lcspectrum.m |
Function called by lcplot.m to compute and plot power spectral
density, coherence and transfer functions from the currently plotted data
files and channels. |
| lcspectrogram.m |
Program to compute spectrograms for an entire data file. |
| lcplotspectrogram.m |
Plotting utility called from lcspectrogram.m. |
| UIlcspectrogram.m |
A GUI tool that allows for batch
processing to compute spectrograms for many data files. |
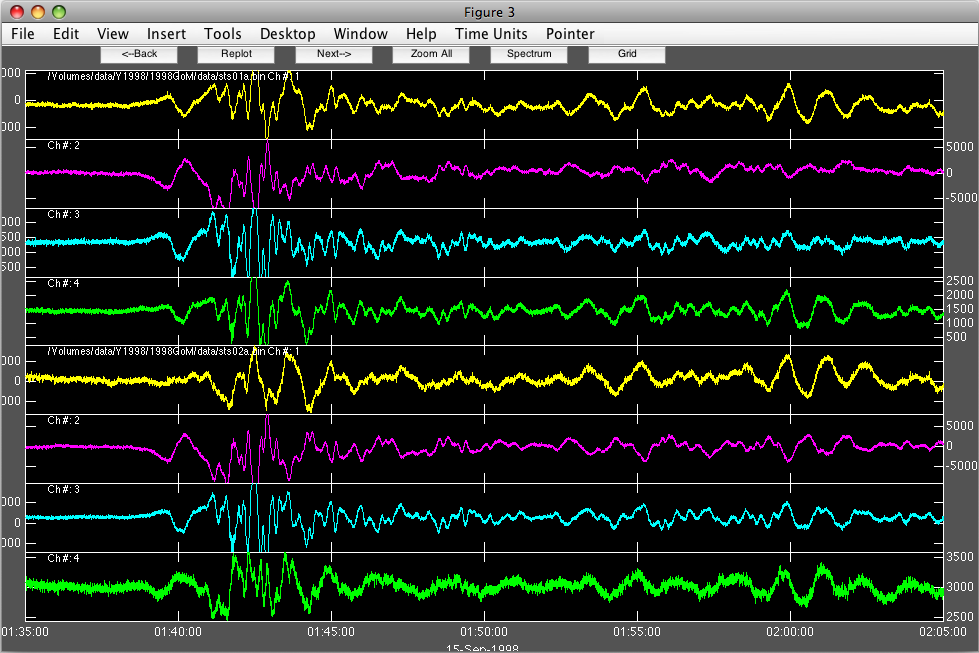
Many data files can be plotted in the same window using lcplot.m. Here is
an example of the time series plotting window. The nice looking signals shown
below are marine MT time series collected from 2 seafloor sites in the northern
Gulf of Mexico. Buttons at the top allow you to move forwards and backwards
through the time series, and to plot power spectral densities, coherences and
transfer function estimates.
|
|
|
|
Last updated: Wednesday, 06-May-2009 14:39:41 PDT
email: sconstable@ucsd.edu
|
|

